Contents
Call Your Shot: Feedback Loops, Experiments, and Writing It Down First
🍎 Low Hanging Fruit
In Game 3 of the 1932 World Series at Wrigley Field, Babe Ruth supposedly pointed toward the center-field bleachers and then hit Charlie Root’s next pitch right where he had pointed. Whether he actually called the home run is still argued about. The newsreel footage is ambiguous, and the people who were there told different stories. But the legend stuck for a reason. Hitting a home run is impressive. Saying where it will land before you swing is a different kind of claim. You can be wrong out loud, and that is what makes it worth believing when you’re right.
Most analytics never calls its shot. A metric moves, someone builds a chart, and the explanation gets written after the result is already in. Revenue went up because of the campaign. Churn went down because of the onboarding change. Maybe so. But if nobody wrote down beforehand what they expected to happen, the explanation is just a story that fits the numbers. Nothing was tested, so nothing was learned.
This article is about fixing that with one cheap habit: before you look, write down what you expect to see. Every launch, every dashboard change, every “let’s try this and see.” That single step turns reporting into a feedback loop, and a feedback loop is how individuals and teams actually get better at their jobs.
The Texas Sharpshooter Problem
There is an old joke about a Texan who fires a few dozen shots into the side of a barn, then walks up and paints a bullseye around the tightest cluster of holes. He’s a perfect marksman, by his own measure.
That is the default way most organizations evaluate their decisions:
- Do the thing.
- Look at whatever metrics moved.
- Draw the target around the ones that moved the right way.
- Present the result as if it were the plan all along.
Researchers have a name for this: HARKing, or Hypothesizing After the Results are Known. Social psychologist Norbert Kerr coined the term in a 1998 paper, and it is one of the main reasons the scientific world moved toward pre-registration, where you publicly commit to your hypothesis, your sample, and your analysis plan before you collect the data. The point of pre-registration is not bureaucracy. It removes your ability to paint the target after the shots are fired.
Business analytics has no peer reviewers checking for this, which means it is worse at it than academia, not better. When a dashboard has forty metrics on it, a few will move in a flattering direction by pure chance in any given week. If you get to pick which ones count after the fact, every initiative looks like a success. And if every initiative looks like a success, you have no way to tell which ones actually were.
Why Calling the Shot Changes Everything
A prediction written down before the result is in does three things that a post-hoc explanation cannot.
1. It makes you falsifiable
“The new onboarding flow will improve retention” is not a prediction. There is no result that disproves it. Retention up 0.1% counts as a win, and retention down can be blamed on seasonality.
“The new onboarding flow will raise 30-day retention from 42% to at least 46% for users who sign up in the next four weeks” is a prediction. It names the metric, the size of the effect, the population, and the time window. It can fail. Because it can fail, it is worth something when it succeeds.
2. It measures your understanding, not just the outcome
The gap between what you predicted and what happened is the most useful number in analytics, and almost nobody records it. If you predicted +4 points and got +4, your mental model of the business is working. If you predicted +4 and got +0.5, the change still “worked,” since retention went up, but your understanding of why customers stay is off by a factor of eight. That gap is where all the learning is, and you can’t see it if you never wrote the first number down.
3. It builds a track record
One called shot is an anecdote. Fifty called shots, scored honestly, are a dataset about your own judgment. After a year, you can answer questions most teams never get to ask:
- When we say we’re “pretty sure,” how often are we right?
- Which kinds of changes do we consistently overestimate?
- Whose forecasts are well-calibrated, and whose are just confident?
Philip Tetlock spent about two decades studying expert forecasters and found that most pundits’ long-range predictions barely beat chance. His later work with the Good Judgment Project also found something more useful: forecasting skill is real, it can be measured, and people get better at it when they make specific, scorable predictions and get honest feedback on them. That isn’t a personality trait. It’s the result of a feedback loop.
The Loop
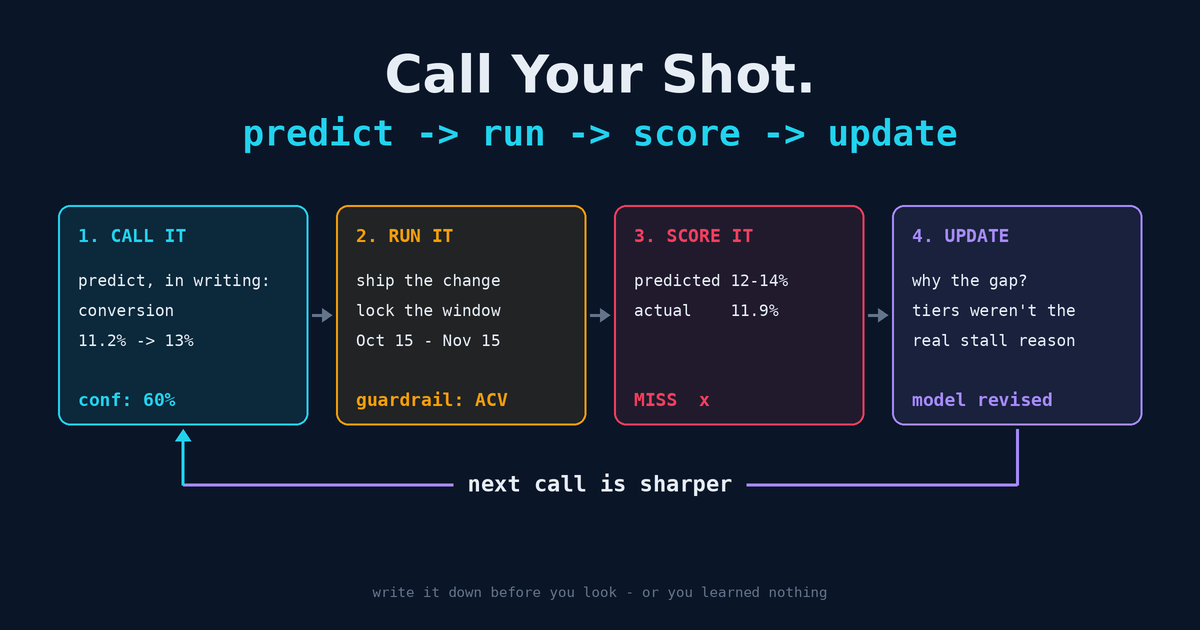
A feedback loop has four steps, and skipping any of them breaks it.
   ┌──────────────┐      ┌──────────────┐
   │  1. CALL IT  │ ───▶ │  2. RUN IT   │
   │  predict,    │      │  ship the    │
   │  in writing  │      │  change      │
   └──────────────┘      └──────────────┘
          ▲                      │
          │                      ▼
   ┌──────────────┐      ┌──────────────┐
   │  4. UPDATE   │ ◀─── │  3. SCORE IT │
   │  revise the  │      │  predicted   │
   │  mental model│      │  vs. actual  │
   └──────────────┘      └──────────────┘
Call it. Before anything ships, write the prediction: metric, direction, size, population, time window, and how confident you are.
Run it. Make the change. If you can hold out a control group, do it. If you can’t, at least lock in the comparison period ahead of time so you can’t shop for a flattering baseline later.
Score it. When the window closes, compare the prediction to the actual result. Hit or miss. Record the gap.
Update it. This is the step everyone skips. Ask why the gap exists. What did you believe about customers, the product, or the process that turned out to be wrong? Write that down too. That sentence is the actual output of the experiment.
Most organizations do step 2 constantly, step 3 occasionally, and steps 1 and 4 almost never. That’s why they run hundreds of initiatives a year and still can’t say what works.
Setting Up an Experiment You Can Actually Learn From
You don’t need an experimentation platform to start. You need a template and the discipline to fill it in before launch. Here is one that fits on an index card:
EXPERIMENT: Simplified pricing page
OWNER:      Dana
DATE CALLED: 2026-10-09   (must be before launch)

CHANGE:      Collapse 4 pricing tiers into 3
METRIC:      Trial-to-paid conversion
POPULATION:  New trials started Oct 15 – Nov 15
BASELINE:    11.2% (trailing 90 days)
PREDICTION:  13.0%  (range I'd accept as "right": 12.0% – 14.0%)
CONFIDENCE:  60%
WHY I THINK SO: Exit surveys say tier confusion is the #1 stall reason.

GUARDRAIL:   Average contract value must not drop more than 5%
KILL SWITCH: If conversion < 10% after 2 weeks, revert

--- filled in after ---
ACTUAL:      11.9%
RESULT:      MISS (below range)
WHAT I LEARNED:
A few rules make this template work:
- The date called must come before the launch date. No exceptions. A prediction written after the data starts coming in isn’t a prediction.
- State a range, not just a point. “13.0%” alone sets you up to miss every time. “12% to 14%” is a claim you can check.
- State a confidence level. “60%” means you expect to be wrong about four times in ten. If you’re right 95% of the time at “60% confident,” you’re sandbagging. If you’re right 20% of the time, you’re overconfident. Either way, you only find out by tracking it.
- Include a guardrail metric. Almost any primary metric can be pushed up by damaging something else. Conversion goes up if you cut prices in half. Name the thing that must not break.
- Name the kill switch in advance. Decide what result makes you stop before you’re emotionally invested in the change.
- Leave “what I learned” blank until the end. It’s the most important line on the card.
Scoring Your Calls With SQL
Once predictions live somewhere structured, even a single spreadsheet or table, you can score your own judgment. Here’s a minimal table:
CREATE TABLE called_shots (
    id              INTEGER PRIMARY KEY,
    owner           TEXT,
    called_on       DATE,
    launched_on     DATE,
    metric          TEXT,
    predicted_low   REAL,
    predicted_high  REAL,
    confidence      REAL,     -- 0.0 to 1.0
    actual          REAL      -- NULL until scored
);
Hit rate by person, counting only predictions that were actually called in advance:
SELECT
    owner,
    COUNT(*)                                             AS calls,
    AVG(CASE WHEN actual BETWEEN predicted_low
                             AND predicted_high
             THEN 1.0 ELSE 0.0 END)                      AS hit_rate,
    AVG(confidence)                                      AS avg_confidence
FROM called_shots
WHERE actual IS NOT NULL
  AND called_on < launched_on          -- no painting targets after the fact
GROUP BY owner
ORDER BY calls DESC;
The comparison that matters is between hit_rate and avg_confidence. Someone averaging 80% confidence with a 45% hit rate is overconfident, and the team should discount their forecasts until that improves. Someone averaging 55% confidence with a 55% hit rate is calibrated, which is rarer and more valuable than being right a lot.
If you want a single number, forecasters use the Brier score, introduced by meteorologist Glenn Brier in 1950 to grade weather forecasts. For a yes/no call, it’s the squared difference between your stated probability and what happened (1 if the call hit, 0 if it missed), averaged across all your calls. Lower is better. Always saying 50% earns a score of 0.25, so anything worse than that means your confidence is actively misleading people.
SELECT
    owner,
    AVG(POWER(confidence -
              CASE WHEN actual BETWEEN predicted_low AND predicted_high
                   THEN 1.0 ELSE 0.0 END, 2))           AS brier_score
FROM called_shots
WHERE actual IS NOT NULL
  AND called_on < launched_on
GROUP BY owner
ORDER BY brier_score;
This is not a performance review tool, and if you turn it into one, people will stop making bold calls and start making safe, vague ones. It’s a mirror. Use it to find out which kinds of decisions your team understands well and which ones it’s guessing at.
The Objections, and Why They’re Wrong
“We don’t have the traffic for proper A/B tests.” You don’t need a randomized controlled trial to call a shot. A before/after comparison with a written prediction and a fixed comparison window is far weaker than a real experiment, but it’s much stronger than a before/after comparison where you pick the window and the story afterward. Call the shot anyway. Be honest in the write-up that it wasn’t a controlled test.
“Writing down predictions will make us look bad when we miss.” It will make you look exactly as good as you are. Without the written prediction, you look good when you’re lucky and blame the market when you’re not, and everyone around you knows it. A team that publishes its misses earns a kind of credibility that a team with a perfect record never gets, because no one believes a perfect record.
“Our business is too complex to predict.” Then your decisions are being made on guesses that nobody is checking, which is a far bigger problem than a missed forecast. Complexity is the argument for tracking predictions, not against it. If you really can’t predict the effect of a change at all, write that down too: “No confident prediction; running this to learn the direction.” That’s an honest call, and it’s still better than inventing a story afterward.
“This slows us down.” The template takes ten minutes. Running a change you can’t learn from wastes the whole cycle, plus the next one where you repeat the same mistake because nobody recorded why it failed.
What a Calling-Shots Culture Looks Like
You can tell when a team has absorbed this habit. A few things change:
- Launch announcements include the prediction: “We expect this to move X from A to B by date C.”
- Retrospectives open with the scorecard (predicted vs. actual) before anyone explains anything.
- “We were wrong, and here’s what we now believe instead” is a normal sentence in a status update, not a career risk.
- Leaders call their own shots in public. This matters more than anything else on the list. If the VP’s pet project is exempt from prediction, everyone learns that calling shots is something only junior people have to do.
- Dashboards stop being museums of things that happened and start being scoreboards for things people said would happen.
That last point connects to a broader theme on this site. A gas gauge is useful because it tells you whether you’ll reach your destination, not just how much fuel you burned. A prediction is the destination. Without one, your KPIs are a record of where you’ve been, and you can’t tell whether you’re on course.
The Low Hanging Fruit
Pick the next change your team is about to ship. It doesn’t need to be big. A copy change on a landing page, a new filter on a report, a tweak to an email cadence, anything with a metric attached.
Before it launches, write five lines in a shared doc or a Slack message with a timestamp:
- The metric you expect to move.
- The current baseline, pulled from real data, not memory.
- Your predicted range after the change.
- The date you’ll check.
- How confident you are, as a percentage.
Then set a calendar reminder for that date. When it fires, pull the actual number, paste it under your prediction, and write one sentence about why the gap is what it is.
That’s the whole exercise. It costs fifteen minutes total. The first time you do it, you’ll probably miss, and the miss will teach you more about your business than the last ten dashboards you built. Do it ten times and you’ll have something almost no analyst has: evidence of how good your judgment actually is, and a way to make it better.
Call your shot. Then go see where it landed.
Related Articles
- Analytics Paints the Picture. It Does Not Prove the Story.: Why the narrative you build around a chart after the fact is not evidence, and how to keep the two separate.
- Crawl, Walk, Run: Why Many Attempts Beat One Perfect Try: Short iteration cycles are what make a feedback loop turn fast enough to matter.
- The Gas Gauge Is the Hardest Chart to Build: KPIs that tell you whether you’ll arrive, not just how far you’ve driven.
- Low Hanging Fruit Reduces Risk and Builds the Expertise to Climb Higher: Small, low-stakes experiments are the cheapest place to practice calling shots.


