Contents
Data Can Just Be Data, If the Org Chart Lets It
🍎 Low Hanging Fruit
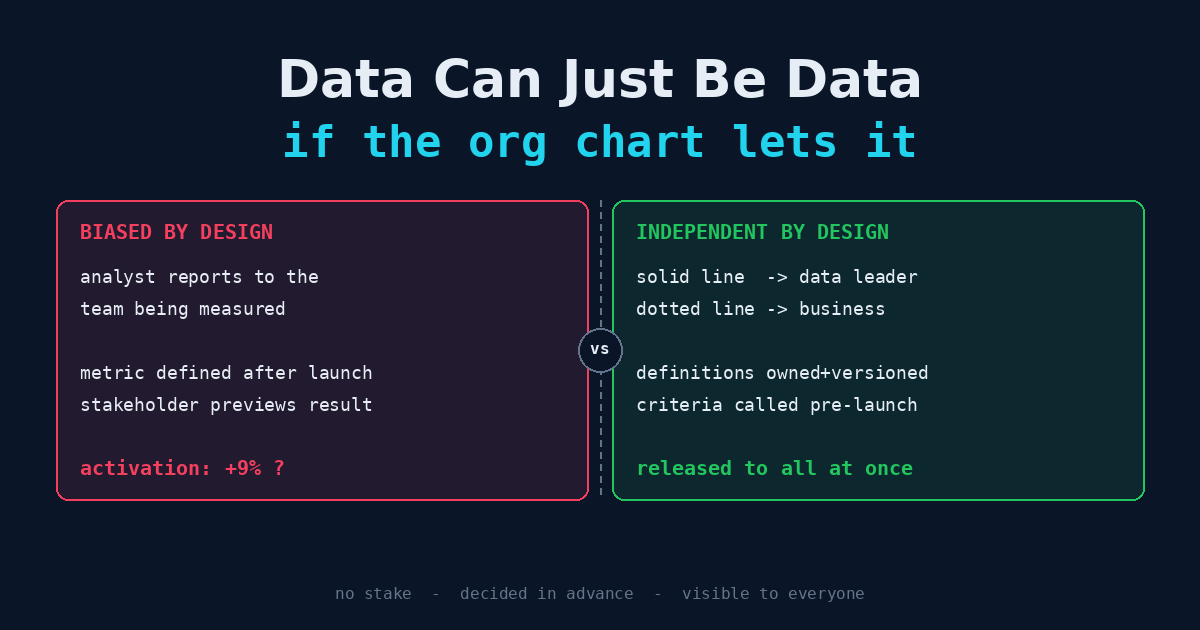
Illustrative example: a product team launches a new onboarding flow. The team has its own embedded analyst, hired by the product director, reviewed by the product director, and sitting in the product team’s standups. Two weeks after launch, the analyst reports that activation is up 9%.
Finance, working from the warehouse, sees no change in paid conversions. The growth team’s dashboard says activation is flat.
Nobody lied. The embedded analyst defined “activated” as completing the new flow’s final screen. That event didn’t exist before the launch, so the baseline was rebuilt from a proxy. The window started the day after a marketing email that pulled in high-intent users. Each choice was defensible on its own. Each was made by someone whose manager had promised leadership that the redesign would work.
That is what stakeholder influence looks like in practice. Not a doctored spreadsheet. A sequence of reasonable choices, all leaning the same direction, made by people who would have had an uncomfortable one-on-one if the number had come back flat.
The fix is not to hire more honest analysts. The analyst in this story was honest. The fix is structural.
First, the Strongest Objection: Data Is Never “Just Data”
The goal in the title deserves pushback before it gets a defense. “Let the data be data” suggests there is a neutral number waiting to be read off the warehouse if only stakeholders would stay out of the way. There isn’t.
Every metric is a stack of decisions:
What counts as an "active" user?          → definition
Which users are excluded (bots, staff)?   → population
Compared to what period?                  → baseline
Over what window?                         → time frame
At what grain? Daily? Per account?        → aggregation
What happens to late-arriving records?    → data handling
Change any line and the number changes. There is no version of the metric that comes with no choices made. A team that claims to be “just reporting the data” has still made all of these choices. It just hasn’t written them down.
So independence cannot mean “numbers without judgment.” That doesn’t exist. What it can mean is narrower and achievable:
The judgment calls behind a number are made by people who don’t benefit from the answer, before the answer is known, and in a way others can inspect.
Three conditions: no stake, made in advance, visible. Every structural recommendation below exists to enforce one of them. “Data can just be data” is shorthand for those three conditions, not a claim that data has no author.
How Influence Actually Gets In
Influence travels through ordinary management channels. Very little of it is intentional. Most of it comes from incentives the analyst can’t escape.
| Channel | How it bends the number |
|---|---|
| Reporting line | The person who writes your review is the person whose initiative you’re measuring. You don’t need to be told what answer is wanted. |
| Budget ownership | The business unit funds the analyst’s headcount. A team that delivers bad news every quarter is a team that gets cut. |
| Queue control | The stakeholder decides which questions get asked. Questions likely to embarrass them never make it onto the board. |
| Definition ownership | The team that ships the feature also defines the metric that judges it, usually after launch. |
| Pre-release review | Results go to the stakeholder before anyone else sees them, with an opportunity to “add context,” which often means changing the cut. |
| The re-cut request | ”Can you try it excluding enterprise accounts?” Asked once, it’s diligence. Asked until the number turns green, it’s p-hacking with extra steps. |
| Proximity | Embedded analysts absorb the team’s beliefs and optimism. Sharing the team’s hopes is not a failure of character. It’s what being on a team does to people. |
Notice that none of these require anyone to act in bad faith. Donald Campbell described the general pattern in 1979: the more a quantitative indicator is used for social decision-making, the more it gets subjected to corruption pressures, and the more it distorts the process it was meant to monitor. Goodhart’s law, from a 1975 paper on monetary policy, makes the same point about targets. The pressure is a property of the incentive structure. Swap in a different analyst and you get the same result with a different name on the slide.
Institutions That Already Solved This
Data teams act like they are the first people to face this problem. They aren’t. At least two older professions have spent decades building structures for producing numbers that powerful people would rather see come out differently.
Internal audit: functional vs. administrative reporting
The Institute of Internal Auditors’ standards separate two reporting lines for the chief audit executive. Functional reporting goes to the board, usually the audit committee. That covers the audit plan, the budget, the head of audit’s appointment and removal, and the results. Administrative reporting goes to a senior executive and covers day-to-day matters like expense approvals, HR processes, and office space.
The design is precise. Management can sign your expense reports. Management cannot fire you for an audit finding, cut your budget to kill an audit, or decide what you are allowed to look at. The people being audited have no control over the auditors’ careers.
That is the template for an independent data function. Most data teams have it exactly backwards. The business owns the functional line (what gets measured, how, and whether the analyst keeps their job). The data organization owns only the administrative line (tooling, standards, a monthly guild meeting).
Official statistics: autonomy, pre-announced releases, no preview
National statistical agencies produce numbers that move markets and end political careers. Unemployment, inflation, GDP. Their safeguards are worth copying almost word for word:
- Professional autonomy. In the U.S., OMB Statistical Policy Directive No. 1 (2014) requires federal statistical agencies to protect their professional autonomy and to be seen as objective, making methodology and release decisions without political influence.
- Pre-announced release schedules. Principal economic indicators are published on a calendar fixed in advance. Nobody gets to delay a bad jobs report until after a convenient event.
- No pre-release editing. In July 2017, the UK Office for National Statistics ended pre-release access to its statistics for government ministers and officials. The argument was simple: if officials see the number first, the public can’t be sure the release wasn’t shaped around them.
And there is a counterexample that shows what happens without these safeguards. Starting in 2007, Argentina’s statistics agency, INDEC, was put under political control. Its official inflation figures diverged so far from private and provincial estimates that in 2013 the IMF issued a declaration of censure against Argentina over the quality of its data. The damage didn’t stop at one bad number. Every number INDEC published was discounted, including the accurate ones, and rebuilding that credibility took years after the agency’s leadership changed.
That is the endgame for a data team that becomes known as the business’s mouthpiece. You don’t lose credibility on the metric that was bent. You lose it on all of them.
Org Models and What They Do to Independence
There are three common ways to structure a data organization. Each trades context for independence differently.
| Model | Who the analyst reports to | Context | Independence | Typical failure |
|---|---|---|---|---|
| Embedded | Business unit leader | High | Low | Analyst becomes the team’s advocate; metrics drift toward flattering definitions |
| Centralized | Head of data | Low | High | ”Ivory tower”: correct numbers about questions nobody asked, delivered too late to matter |
| Hub-and-spoke | Head of data (solid line), business unit (dotted line) | Medium–high | Medium–high | Dotted line quietly becomes the real line if the hub is weak |
The strongest argument for embedding is real. An analyst who sits with the team understands the product, hears about the weird edge case in standup, and gets asked the right question at the right time. Centralized teams routinely produce rigorous work that misses what the business actually cares about. Pure independence without context is how you end up with dashboards nobody opens.
So the answer is not to centralize everyone. It’s hub-and-spoke with the lines drawn the way internal audit draws them:
- Solid line to the data organization. The data leader writes the performance review, owns the headcount, and makes the promotion decision. That’s the functional line.
- Dotted line to the business. The business sets priorities within the analyst’s queue, includes them in planning, and gives feedback that goes into the review but doesn’t decide it. That’s the administrative line.
- Analyst sits with the business. Physical and social proximity provides the context. The reporting line provides the protection.
An analyst in this setup can tell a product director that the launch didn’t work and still get promoted. That is the whole test.
Where should the data leader report?
There is no perfectly neutral seat, and anyone who tells you otherwise is selling something.
- Under a revenue-owning executive (CMO, CRO, Chief Product Officer). This is the worst option. The data function now measures its own boss’s results.
- Under the CFO. This is common and better, because finance is used to controls and reconciliation. But finance has a stake too: hitting the plan it set. Forecast-vs-actual analysis that embarrasses the plan is exactly what a CFO-owned team will feel pressure to soften.
- Under the COO or CEO. This is the closest to neutral because these executives answer for the whole business rather than one line of it. The cost is less attention and a longer path to decisions.
- With a governance tie to the board or audit committee for a few critical metrics, such as the ones reported externally or tied to compensation. This is rare outside regulated industries, but it’s the right model when executive pay depends on a number.
The guiding rule: put the data leader under the executive with the least personal stake in any single metric, then add mechanisms to cover the stake that remains.
The Org Chart Is Necessary, Not Sufficient
Reporting lines handle the career pressure. They don’t handle the decisions that get made one metric at a time. For those, you need mechanisms.
1. Definitions are owned centrally and versioned
Whoever ships a feature should not define the metric that grades it. Metric definitions belong in a central, version-controlled semantic layer owned by the data organization. Changes go through review, get a changelog entry, and are restated backward so the trend line stays comparable.
metric:   activated_user
owner:    data-platform (not product)
version:  3
changed:  2026-09-02
change:   added "completed profile" requirement
reason:   v2 counted bounced signups as activated
backfill: restated to 2025-01-01
approved: metrics review board
If a team wants a new definition, they can propose one. They can’t adopt it quietly the week their launch needs it.
2. Success criteria are written down before launch
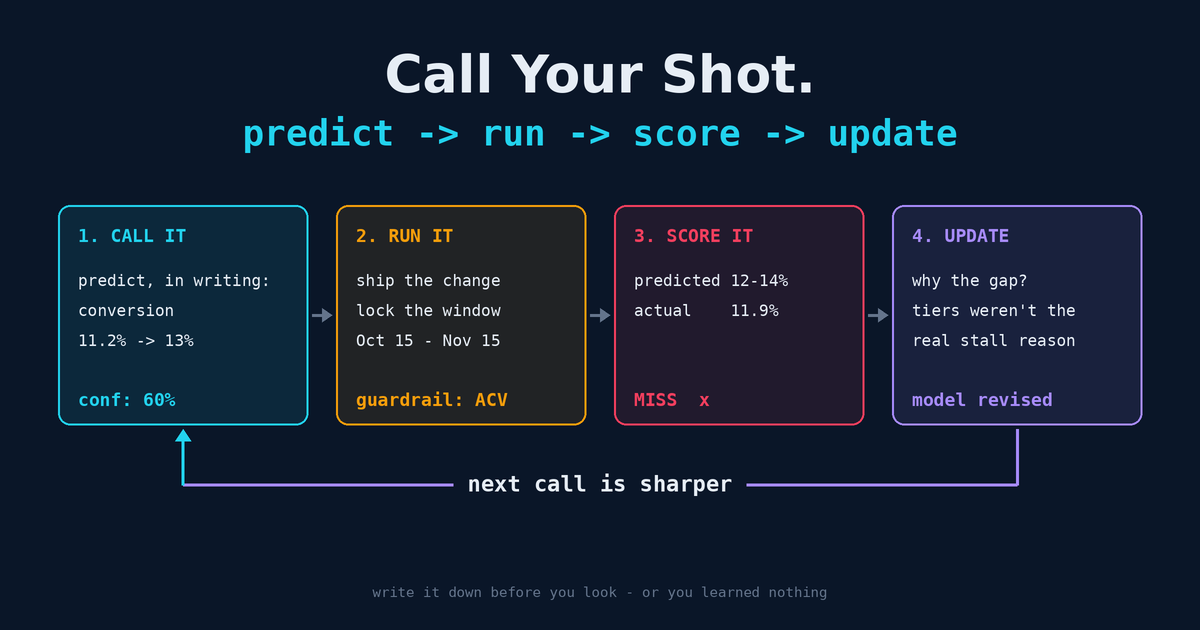
The single highest-leverage habit is calling your shot: write down the metric, baseline, window, population, and expected effect before the data comes in. Once the criteria are fixed in advance, the re-cut request loses most of its force. You can still explore other cuts, but they get labeled as exploratory, not as the result.
3. Results are released, not previewed
Borrow the statistical agencies’ rule. When a scheduled analysis is done, it goes to everyone on the distribution list at the same time. The stakeholder can add commentary next to the result. They don’t get to edit it before others see it.
This one causes the most friction, because executives are used to “getting ahead of” bad news. Compromise if you have to: give the stakeholder a short heads-up, hours rather than weeks, with the number locked. Getting ahead of the news is fine. Editing the news is not.
4. Review the methodology, not the conclusion
Peer review inside the data organization should ask “Is this method sound?”, not “Will the stakeholder like this?” A useful test: if the result had come out the other way, would the reviewer have accepted the same method? If the method only gets challenged when the answer is inconvenient, the review is biased, even if every individual challenge is technically valid.
5. Analysts have an escalation path that doesn’t go through the stakeholder
When a stakeholder pushes back on a result, the analyst should be able to escalate to the data leader, who then takes the conversation peer to peer. A junior analyst should never be the only person standing between a vice president and a number the vice president doesn’t like. That’s not independence. It’s a test of nerve the organization set up for that analyst to fail.
6. Separate who asks from who decides what gets measured
Stakeholders should absolutely shape the question queue. They know the business. But the data organization should reserve some capacity for questions no one asked: the wide-angle view, the cross-team comparison, the unflattering total. If every analysis has a sponsor, the uncomfortable ones will never get done.
Independence Is Not Indifference
There is a failure mode on the other side, and data teams that win the independence argument fall into it all the time.
- The data police. The team treats every stakeholder request as a manipulation attempt, every hypothesis as bias, every deadline as pressure. Stakeholders stop asking. The team is very independent and completely irrelevant.
- Gatekeeping disguised as rigor. “We can’t answer that until the data is perfect.” Independence was meant to protect the truth, not to excuse never delivering it.
- Neutrality theater. The team refuses to make recommendations because “data should speak for itself.” It doesn’t. Someone has to say what the picture means. An independent team should make more direct recommendations, because it’s the one group that can afford to.
Internal audit offers the right posture here too. The best audit functions are independent and useful. They know the business deeply, flag risks early, and help fix what they find. Independence is what makes their advice worth listening to. It isn’t a reason to hold the advice back.
The analyst who is half embedded in the domain and half independent of it is the target. Enough context to be right about the business. Enough distance to say so when the business is wrong.
A Diagnostic: How Independent Is Your Data Team?
Answer these honestly. Each “no” marks a place where stakeholder influence can get in.
| Question | Condition it protects |
|---|---|
| Can an analyst deliver a result that embarrasses their business partner without career risk? | No stake |
| Does the data organization, not the business unit, write analysts’ performance reviews? | No stake |
| Are core metric definitions owned by someone other than the teams they measure? | No stake |
| Are success criteria for launches and initiatives written down before launch? | In advance |
| Are recurring metrics published on a fixed schedule regardless of what they show? | In advance |
| Do stakeholders see results at the same time as everyone else, without editing rights? | Visible |
| Is every metric definition change logged and backfilled? | Visible |
| Has the data team published an unflattering result in the last two quarters? | All three |
That last question matters most. A data team that never delivers bad news isn’t working in a company where everything is going well. Its independence has failed somewhere, and nobody has noticed yet.
The Low Hanging Fruit
Reorgs are slow and political. You don’t need one to start:
- Pick the three metrics leadership argues about most. Move their definitions into a single version-controlled file owned by the data team, with a changelog. That costs an afternoon and closes the definition-ownership channel for the metrics that matter most.
- Add a “called before launch” field to every launch review. No prediction written down, no victory lap later. This closes the re-cut channel.
- Change one recurring report from preview to release. Pick the weekly or monthly report that usually goes to one executive for “review” before it’s shared. Send it to everyone at once. See what happens.
- Write the escalation path down. One sentence in the team charter: analysts escalate pushback on results to the data leader, not the stakeholder’s manager.
Data never speaks for itself. It always has an author. What an organization can control is whether that author has something to gain from the answer. Build the structure so they don’t, make the choices in advance, show your work, and the numbers will be as close to “just data” as numbers get.
Related Articles
- Analytics Paints the Picture. It Does Not Prove the Story. — The analyst-level version of this problem: how a narrative sneaks in through chart defaults and hyper-focused slices.
- Call Your Shot: Feedback Loops, Experiments, and Writing It Down First — The mechanics of pre-registering a prediction so nobody can move the goalposts after the data arrives.
- From Cheerleader to Quarterback — How much domain expertise an analyst needs before it starts to cost them their independence.
- The Telephone Game Is How Analytics Goes Wrong — Another way the question gets bent on its way to the analyst, this time through handoffs rather than incentives.